Metrics in Nimbuz: Monitor CPU, RAM, and CPU Throttle

Modern applications require continuous monitoring to maintain performance, reliability, and scalability. Without proper visibility into system resources, it becomes difficult to identify bottlenecks, optimize workloads, or prevent downtime.
Nimbuz provides built in Application Metrics that help you monitor CPU usage, memory consumption, and overall resource utilization in real time. These insights enable teams to track application health, troubleshoot issues quickly, and make informed scaling decisions.
Nimbuz Introduction
Nimbuz is a PaaS platform designed to simplify application deployment by removing infrastructure complexity. It automates networking, and scaling so developers can focus purely on code.
Why Application Metrics Matter
Monitoring application metrics helps you:
- Detect performance issues before they impact users
- Track CPU and memory consumption trends
- Identify resource bottlenecks
- Optimize application performance
- Improve infrastructure planning and scaling
- Maintain application stability and uptime
With centralized monitoring in Nimbuz, teams can gain operational visibility without relying on external monitoring tools.
What You Can Monitor in Nimbuz
Nimbuz provides real time visibility into key application resources, including:
CPU Usage
Track how much processing power your application is consuming. High CPU usage may indicate:
- Increased traffic
- Inefficient processes
- Background tasks consuming resources
- Scaling requirements
Monitoring CPU helps ensure your application performs efficiently under varying workloads.
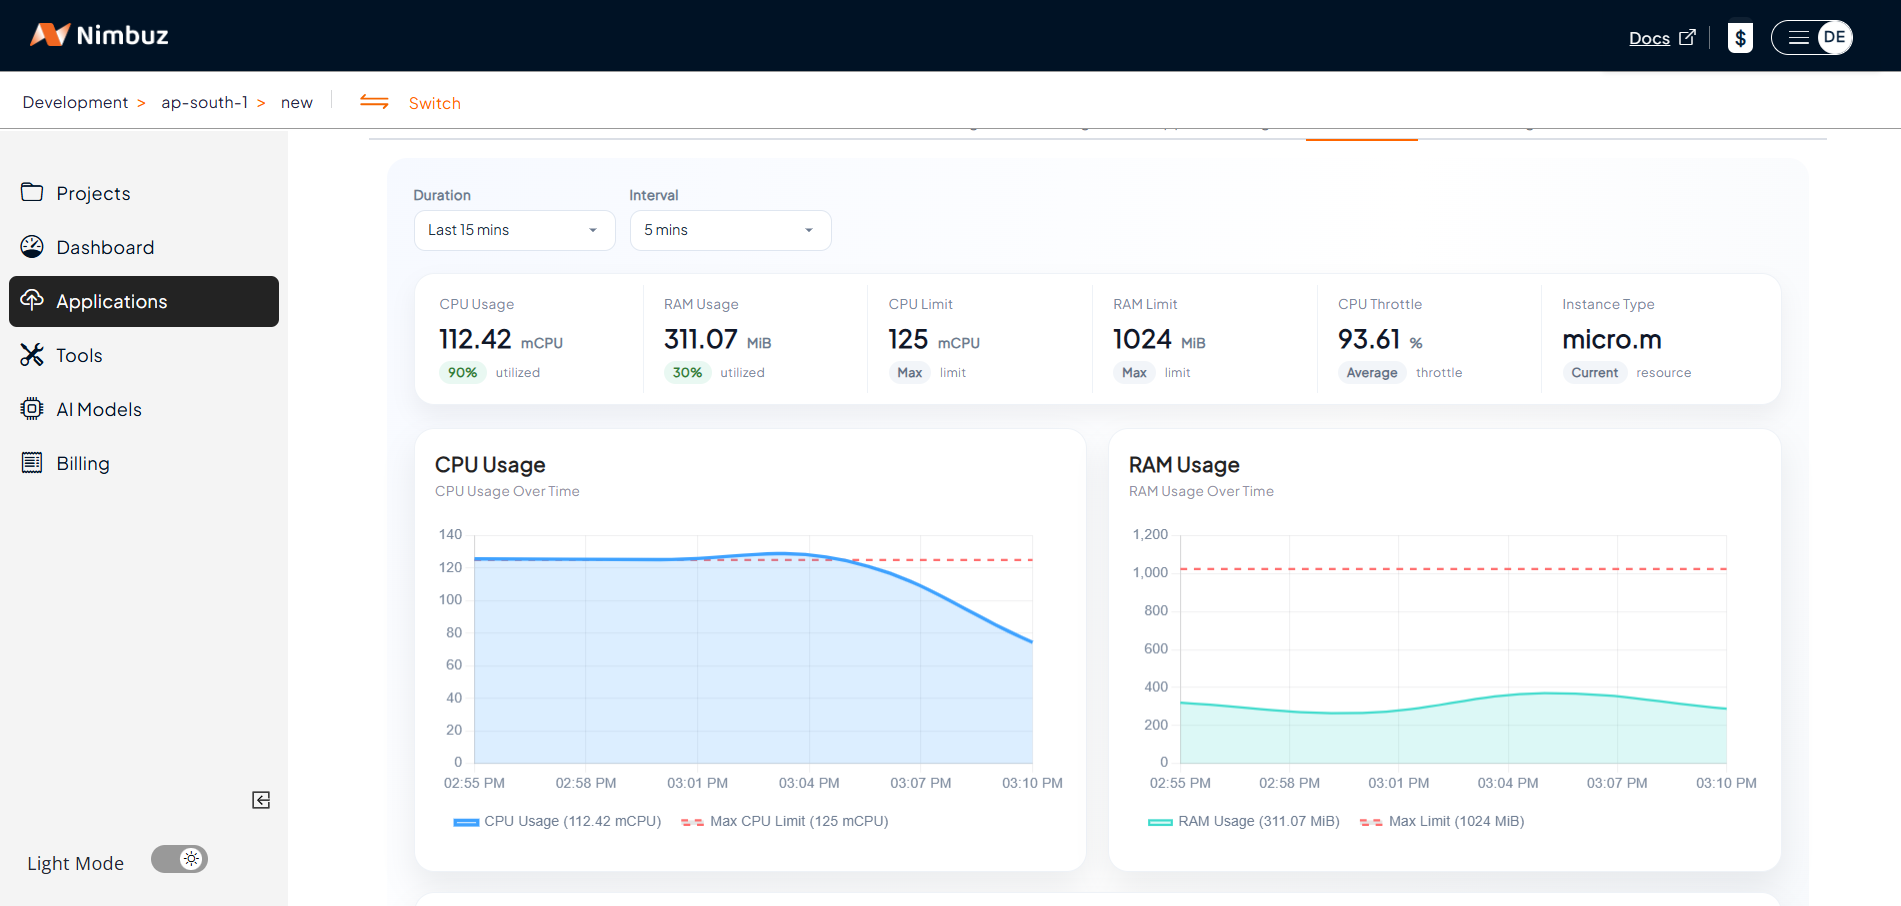
RAM Usage
View memory consumption patterns to identify memory intensive operations or potential leaks.
Tracking RAM usage helps you:
- Prevent application crashes due to memory exhaustion
- Optimize resource allocation
- Improve application stability
- Understand workload behavior
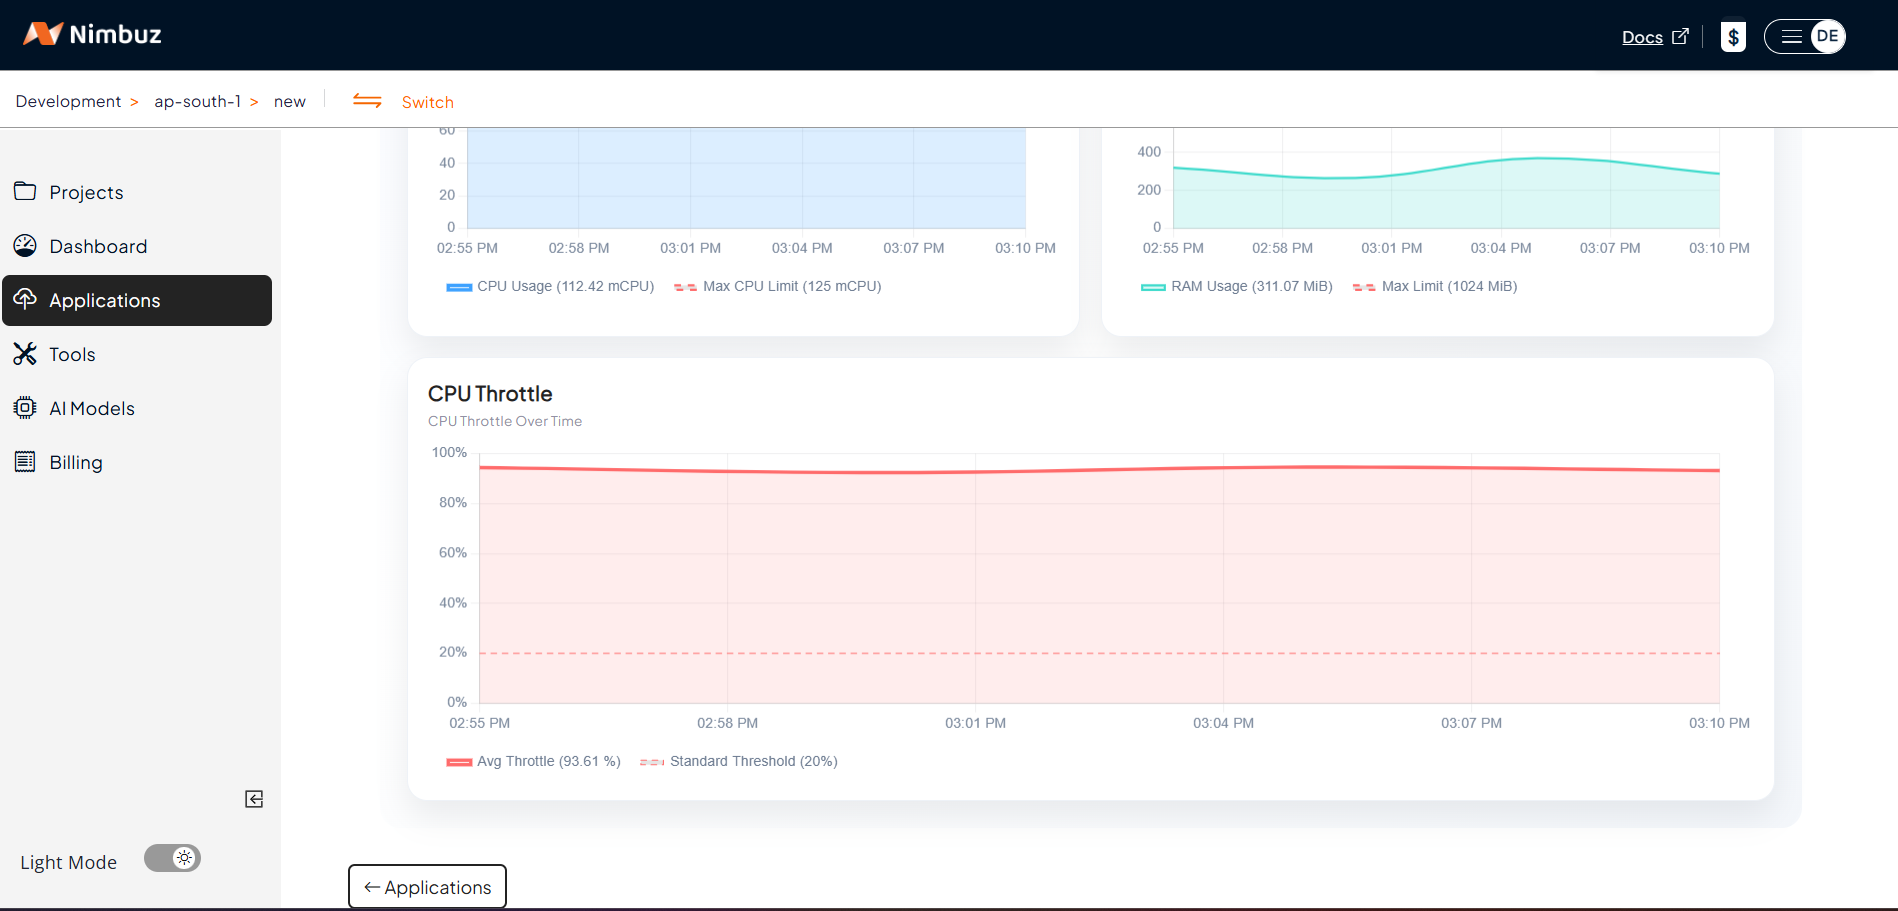
CPU Throttle
The CPU Throttle chart provides:
- Average Throttle Percentage over time
- Standard Threshold Indicators
- Historical throttle trends
- Real time monitoring visibility
These metrics help teams determine whether additional CPU resources are required for optimal performance.
Accessing Application Metrics in Nimbuz
To view application metrics:
- Log in to your Nimbuz dashboard
- Navigate to Applications
- Select your deployed application
- Open the Metrics tab
The Metrics dashboard displays real-time and historical resource usage data for your application.
Benefits of Built In Metrics Monitoring
Real Time Visibility
Monitor live resource usage and quickly identify abnormal behavior.
Faster Troubleshooting
Analyze CPU and memory spikes to diagnose performance issues efficiently.
Better Scaling Decisions
Use actual usage patterns to determine when to scale applications or optimize workloads.
Improved Application Reliability
Continuous monitoring helps maintain application stability and performance consistency.
Optimize Performance with Nimbuz Metrics
Application monitoring is essential for maintaining modern cloud native workloads. With Nimbuz Application Metrics, teams can monitor CPU, RAM, and resource utilization from a single dashboard, helping ensure applications remain stable, responsive, and scalable.
By leveraging real time insights, developers and operations teams can proactively optimize performance and improve the overall reliability of their applications.