Nimbuz Dashboard: Real Time Cost, Workload & Endpoint Insights

Introduction
Modern cloud applications need continuous monitoring to stay reliable and efficient. A dashboard brings important information into one place, making it easier to understand application performance, resource usage, costs, and system health.
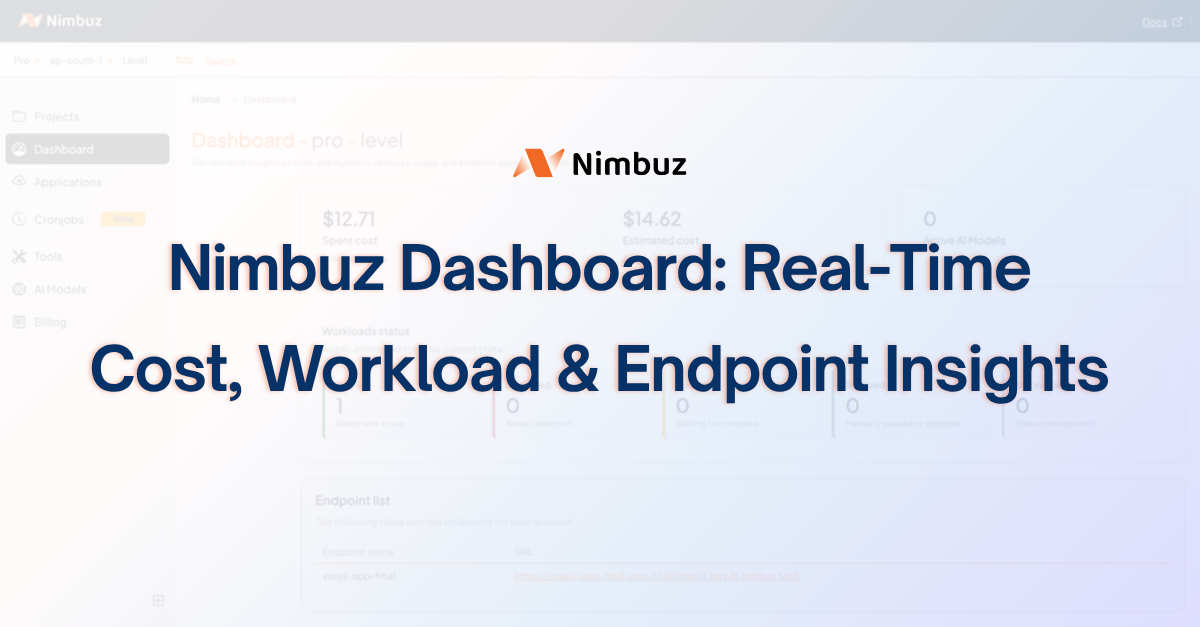
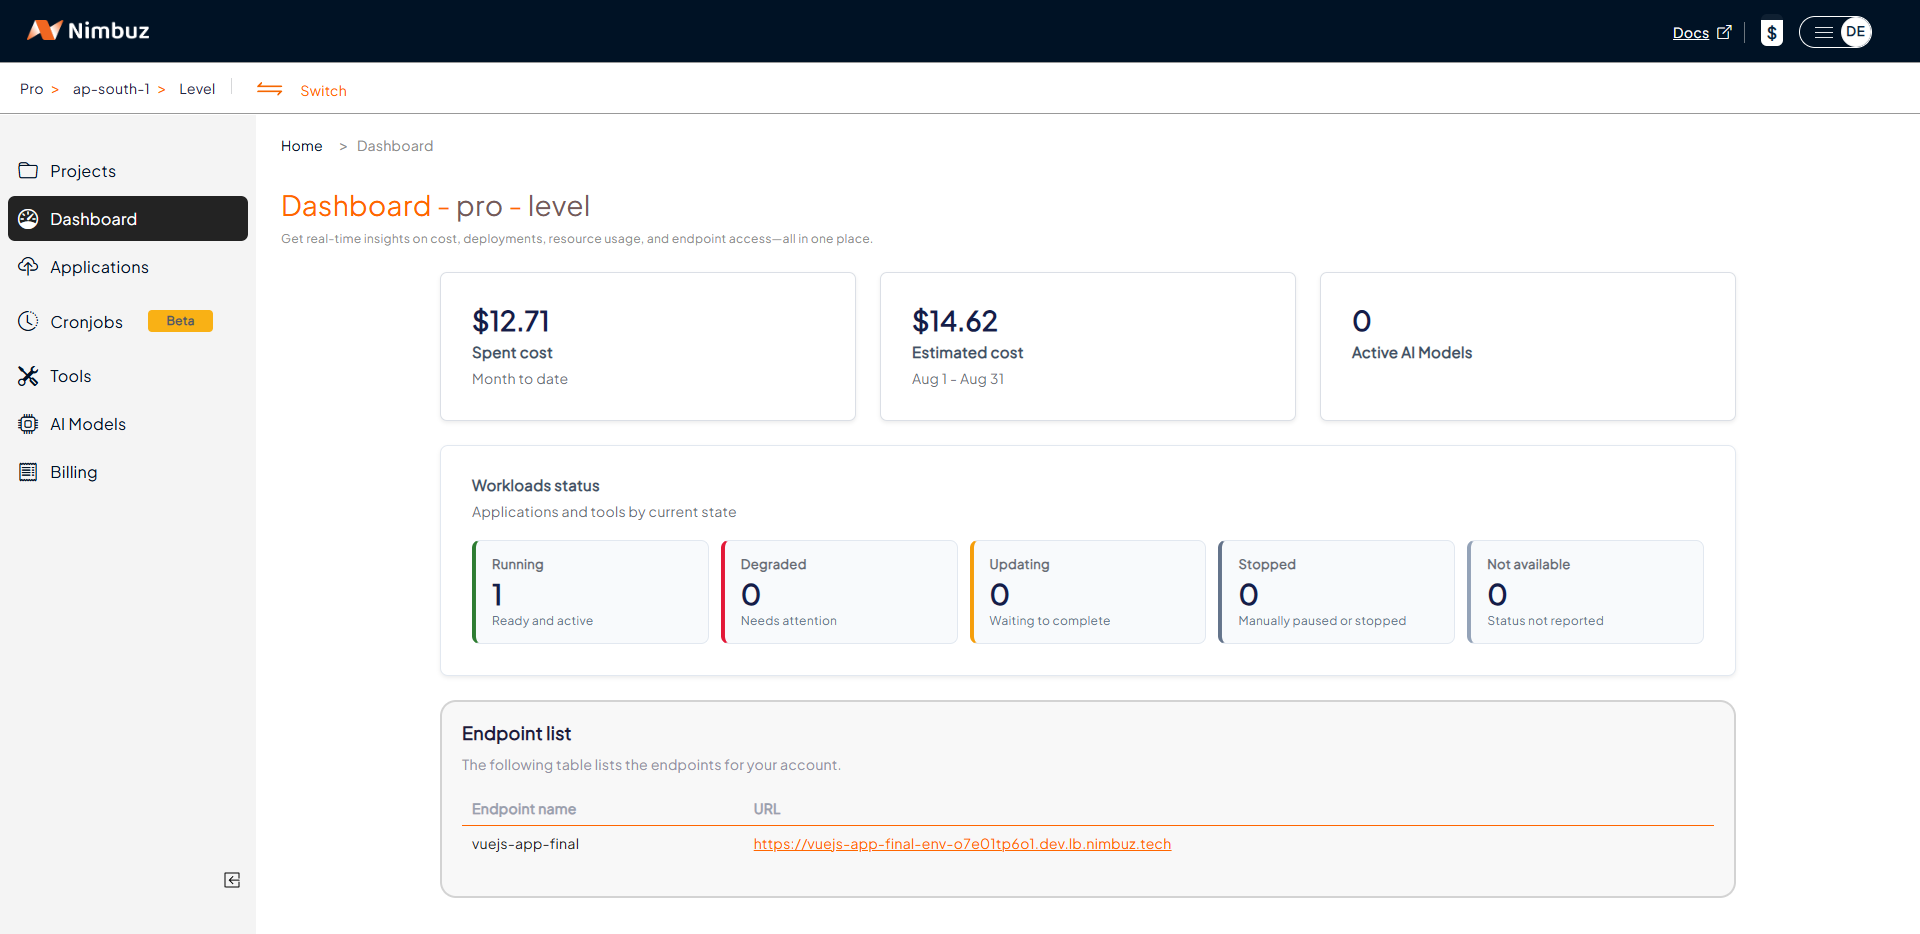
Nimbuz is an example of a cloud platform that provides dashboard features for monitoring cost, workloads, applications, tools, and endpoints. These features help users quickly understand what is happening in their cloud environment.
This article explains the main types of information a cloud dashboard can provide and why they are useful.
Cost and Usage Tracking
Cloud resources can create costs based on how much they are used. Tracking this usage helps teams understand where their resources and money are being spent.
A dashboard can show information such as:
- Current cost
- Daily usage
- Monthly usage
- Resource consumption
- Cost trends
For example, if an application starts using more computing resources, the dashboard can help identify the increase in usage and its effect on cost.
Regular cost tracking also helps teams find unexpected usage and make better decisions about resource allocation.
Workload Status
A workload is a running application or service that uses cloud resources. Monitoring workload status helps users know whether their applications are running normally.
A dashboard can show simple status information such as:
- Running
- Stopped
- Starting
- Failed
- Deploying
For example, if an application deployment fails, the dashboard can show the failed status. This allows the team to investigate the issue without checking every application separately.
Workload status is especially useful when managing multiple applications and environments.
Application and Tool Health
Applications and supporting tools depend on different services and resources. Monitoring their health helps identify problems before they affect users.
A dashboard can provide health information for applications and tools, such as:
- Healthy
- Unhealthy
- Warning
- Not available
For example, an application may be running, but one of its supporting services may have a problem. Health information can help identify this type of issue more quickly.
Health monitoring also provides a quick view of the overall environment.
Endpoint Monitoring
An endpoint is a URL or network location that an application exposes for communication. For example, an application may have an API endpoint such as /api/users.
Monitoring endpoints helps check whether these application entry points are available and responding correctly.
A dashboard can show information such as:
- Endpoint status
- Response availability
- Response time
- Error conditions
- Recent endpoint activity
For example, if an API endpoint becomes unavailable, the dashboard can help identify the affected endpoint and allow the team to investigate the problem.
Endpoint monitoring is useful for applications that provide APIs or other services to users and systems.
Benefits of a Dashboard
A centralized dashboard provides several practical benefits.
Faster Monitoring
Users can see important information in one place instead of checking multiple pages or systems.
Easier Problem Detection
Status and health indicators can make problems easier to identify. For example, a failed workload or unhealthy endpoint can be noticed quickly.
Better Cost Awareness
Cost and usage information helps teams understand resource consumption and avoid unexpected spending.
Improved Resource Management
Usage information can help teams decide whether resources need to be increased, reduced, or reviewed.
Better Visibility
A dashboard provides a simple overview of applications, workloads, tools, costs, and endpoints. This gives teams a clearer view of their cloud environment.
Conclusion
A cloud dashboard is useful for monitoring different parts of an application environment from a single location. Cost and usage tracking helps understand spending, workload status shows whether applications are running, health information helps identify problems, and endpoint monitoring checks application access points.
Platforms such as Nimbuz bring these types of insights together in a single dashboard. With clear and simple monitoring information, teams can understand their environment faster, identify issues earlier, and make better decisions about their cloud resources.